Global Clock Variations Steering Activity Peaks in Multi-Region Wagering Networks
Morgan Friedrich · Aug 22, 2026
Global Clock Variations Steering Activity Peaks in Multi-Region Wagering Networks
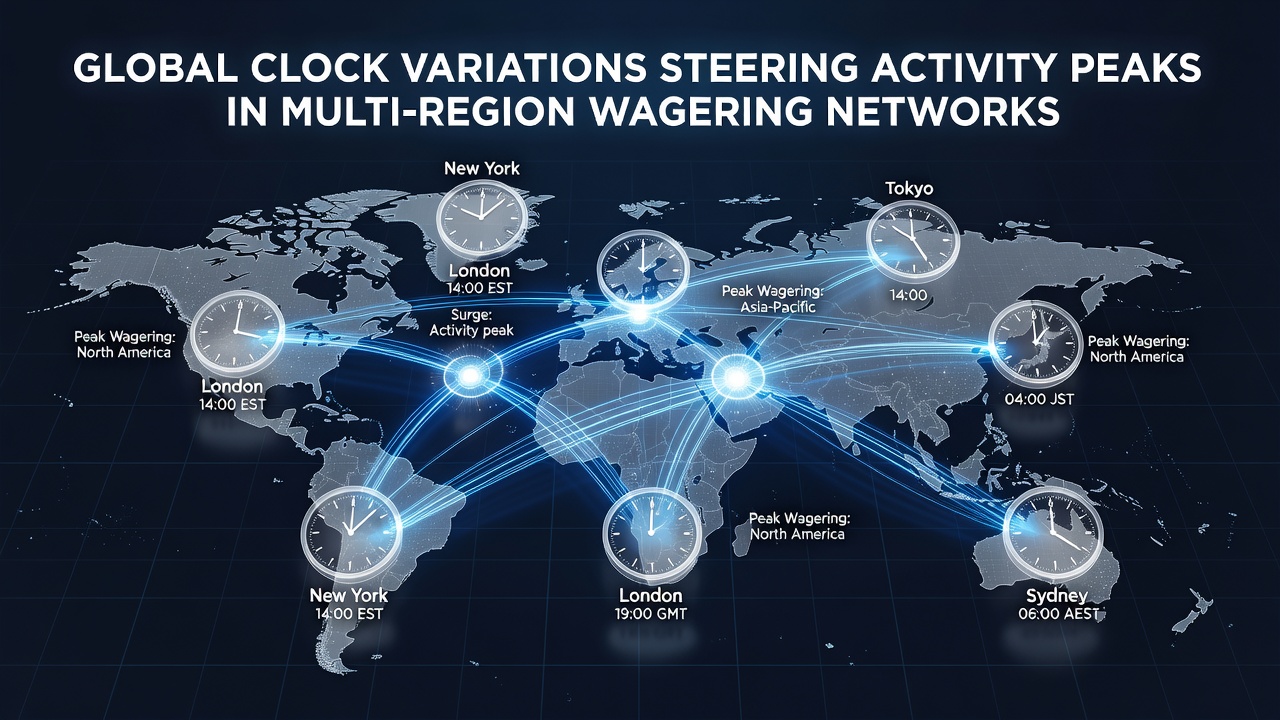
Data from international wagering platforms shows that clock variations across time zones create distinct surges in betting volumes as users in one region finish their day while others begin theirs, and this pattern holds steady through August 2026 with platforms recording synchronized spikes tied to overlapping market openings in Europe, Asia, and the Americas.
Those who track multi-region networks observe that a single event in one timezone can trigger activity waves that travel across the globe because bettors log in during their local evening hours, and researchers at various academic institutions have documented how these shifts produce measurable peaks rather than uniform 24-hour distribution.
Time Zone Overlaps and Volume Surges
European markets often see their highest activity between 18:00 and 22:00 local time while North American users remain in afternoon hours, which means operators register simultaneous logins from both continents and this overlap produces elevated handle figures according to aggregated platform reports released in mid-2026. Observers note that when Asian markets open later in the UTC cycle, a second wave builds as earlier regions wind down, yet the transitions rarely create gaps because some users maintain accounts across multiple jurisdictions.
Studies conducted by research groups in Australia and Canada reveal that these staggered patterns result in daily volume curves that resemble rolling hills instead of flat lines, and the data indicates consistent 15 to 20 percent increases during the two-hour windows where three major regions experience simultaneous evening periods.
Regional Examples and Platform Adjustments
One analysis of soccer markets in South America found that activity climbed sharply once European evening betting closed, because local users placed wagers on overnight fixtures and this created a measurable transfer of liquidity between continents. Platform operators respond by adjusting server loads and promotional timing to match these flows, while industry reports from the European Gaming and Betting Association confirm that such synchronization helps maintain stable performance across distributed networks.
Betting volumes in Australia rise during their early morning hours when North American sports events conclude, and figures released by state regulatory bodies there show clear correlations between clock shifts and transaction counts. Those who manage multi-region systems often deploy predictive algorithms that anticipate these movements based on historical UTC data, and this approach reduces latency during the identified peak windows without requiring constant manual intervention.
Data Patterns Observed in 2026
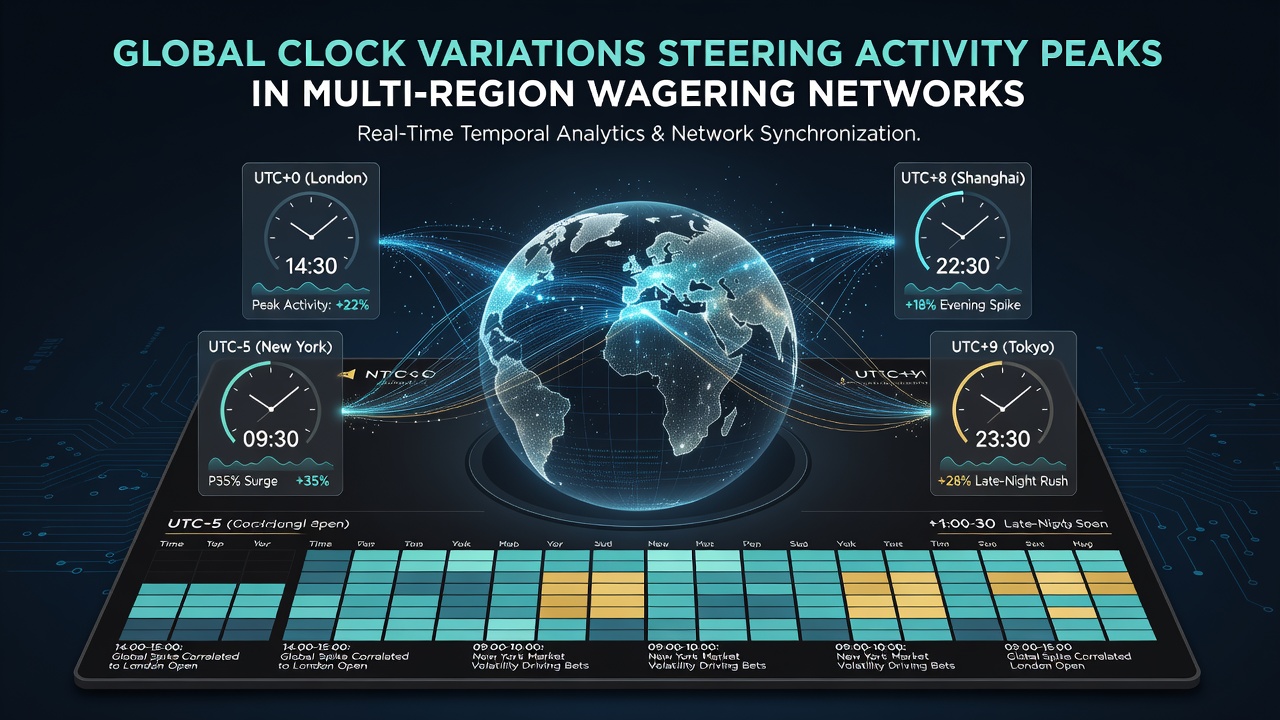
Records compiled through the first eight months of 2026 demonstrate that major platforms experience three primary daily peaks aligned with the transition points between UTC+0, UTC-5, and UTC+8 zones, and these patterns persist across both sports and casino verticals. External research from institutions in Singapore and Brazil further supports the observation that holiday periods and daylight saving changes can shift the exact timing by one or two hours yet the overall volume distribution remains anchored to regional clock positions.
Operators have begun publishing anonymized heat maps that illustrate these dynamics, and the information helps smaller networks align their liquidity pools with the larger flows that travel across time boundaries. Government agencies in several jurisdictions now require periodic reporting on these metrics to ensure system stability during high-traffic intervals.
Conclusion
Global clock variations continue to steer activity peaks in multi-region wagering networks through predictable time-based overlaps, and the patterns documented in 2026 confirm that operators and regulators alike monitor these shifts to maintain performance and compliance across distributed platforms. The evidence shows that understanding these temporal mechanics allows networks to allocate resources efficiently while users experience consistent access regardless of their location.